


OAnalyzer app for iPhone and iPad
Developer: The Fizix Group
First release : 25 May 2015
App size: 2.12 Mb
The Orange Analyzer will allow you to graph data and find the trends that are present. You can either input your own data from a lab exercise, or import it from one of the three most popular spreadsheet apps.
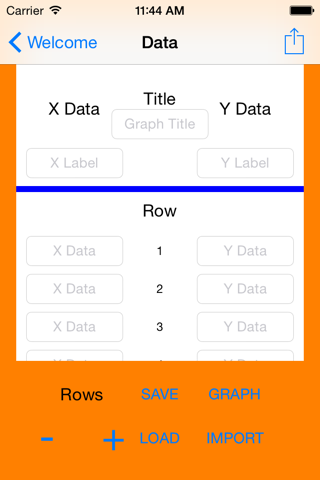
Once you have hit the start button and get to the data entry screen, enter your graph title and axis information in the appropriate spaces.
Next, input your data. If you need more spaces for data, hit the plus button. For less, hit the negative button.
After you have entered all of your information, you can save your data by pressing the save button and naming your file. You can also recall your data by hitting the load button.
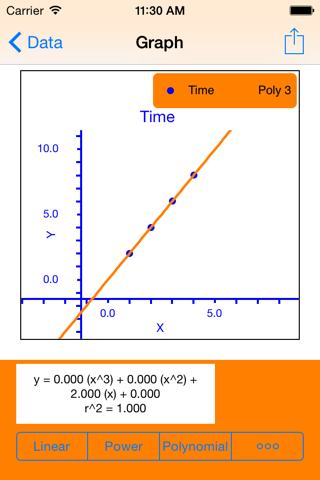
You can then graph your data by hitting the graph button. This will bring up a graph of all of your data, plotted on the X and Y axes with labels and titles. Touch any point and find out its values. At the bottom of the screen are choices for your regression line.
Choose one and see if it fits your data by reading the information in the stats window. If your R-squared comes out near 1, you know that its a good fit. If not, choose another type and check that R-squared value.
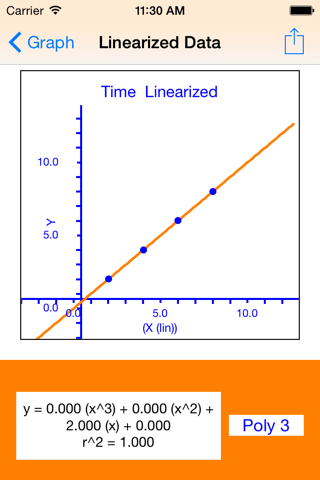
Once you have a trend figured out, you will also have the option to linearize the data. Hit the linearize button and this will bring up a graph of your data linearized with the regression you chose. This will also give you the linearized formula in the format of y = m(x) + b.
And dont forget that any screen with a share icon is able to be printed on available air printers.